Tutorial - Monitoring Roboconf with Apache Decanter
It is assumed here that you followed this previous tutorials and are familiar with Roboconf.
This tutorial shows how to install and configure Apache Decanter to monitor Roboconf (DM and agents) with Elastic Search and Kibana. The big picture is that…
- … Decanter retrieves metrics from the machines and the Roboconf distributions.
- … these metrics are sent in an Elastic Search instance / cluster.
- … Kibana dashboards are used to show and filter monitoring information.
ELK Installation
Elastic Search and Kibana are a well-known solution to collect and display data.
To make things easy (find the right versions that work together), we are going to use Docker to run them.
Docker installation is documented on their web site.
Elastic Search and Kibana have different versions and some combinations do not work.
We here use compatible versions.
Just like Rabbit MQ, Elastic Search must be reachable by the DM and all the agents. So, it should be installed on a server / VM with a public IP address.
To make things simple, it is possible to deploy both containers on the same machine.
Lets begin with Elastic Search.
docker pull elasticsearch:5.1.1-alpine
docker run --name rbcf-elasticsearch -p 9200:9200 -d elasticsearch:5.1.1-alpine -E "http.host=0.0.0.0" -E "transport.host=127.0.0.1"
By default, the container exposes the ports 9200 and 9300.
9300 is the port to retrieve data. The Kibana container will contact it
locally. On the other hand, the port 9200 is used to inject data. It will be
used by remote Roboconf agents. This is why we make it available at the host level.
Notice that we start Elastic Search in development mode.
If you want to build a cluster of Elastic Search nodes, you may have to
upgrade settings of the host system,
even when you use Docker.
If one wants to make data persistent, use a volume.
-v "$PWD/esdata":/usr/share/elasticsearch/data
Let’s now deal with Kibana.
It must be started after Elastic Search.
docker pull kibana:5.1.1
docker run --name rbcf-kibana --link rbcf-elasticsearch:elasticsearch -p 5601:5601 -d kibana:5.1.1
We expose the port 5601, so that web browsers can access it.
The dashboards are available at http://localhost:5601/app/kibana
It may take some seconds for Kibana to be fully ready.
Notice that is is also possible to embed Elastic Search and Kibana directly in Karaf. We do not recommend this approach.
Decanter Installation
Decanter is a monitoring extension for Karaf.
Decanter can collect information from several sources and forward them
to appenders that will store / process the collected information.
In the scope of this tutorial, we will use JMX as the collector (to get system information). And we use the Elastic Search appender. Concretely, Karaf will regularly pull JMX probes and send the collected data to Elastic Search.
Decanter can / should be installed in both the DM and agents.
For agents, it should be installed at the image’s creation (the image that will be used
as a basis for all the VMs Roboconf will instantiate).
Get Karaf’s client and type in…
# Indicate where to get Decanter features
feature:repo-add mvn:org.apache.karaf.decanter/apache-karaf-decanter/1.3.0/xml/features

# Install JMX support in Roboconf
feature:install management

# Install what we need
feature:install decanter-collector-jmx
feature:install decanter-appender-elasticsearch-rest
Notice that by default, decanter-collector-jmx creates a configuration file
named org.apache.karaf.decanter.collector.jmx-local.cfg. For those who do not want
a default file to be created automatically, it is possible to use decanter-collector-jmx-core
instead.
Decanter Configuration
The Elastic Search configuration is defined in etc/org.apache.karaf.decanter.appender.elasticsearch.rest.cfg.
# HTTP address of the elasticsearch node
# NB: the appender uses discovery via elasticsearch nodes API
address=http://localhost:9200

# Basic username and password authentication
# username=user
# password=password
Update the IP address.
If you configured basic authentication in Elastic Search, add the user name and
password in the client configuration.
The JMX configuration has to be defined in a file that follows this convention:
org.apache.karaf.decanter.collector.jmx-<some name>.cfg. By default, decanter-collector-jmx
creates a configuration file named org.apache.karaf.decanter.collector.jmx-local.cfg.
#
# Decanter Local JMX collector configuration
#

# Name/type of the JMX collection
type=jmx-local

# URL of the JMX MBeanServer.
# local keyword means the local platform MBeanServer or you can specify to full JMX URL
# like service:jmx:rmi:///jndi/rmi://hostname:port/karaf-instance
url=local

# Username to connect to the JMX MBeanServer
#username=karaf

# Password to connect to the JMX MBeanServer
#password=karaf

# Object name filter to use. Instead of harvesting all MBeans, you can select only
# some MBeans matching the object name filter
object.name=java.lang:*

# You can add any custom field that the collector will "forward" to the dispatcher
# For instance:
#
# my=stuff
The local URL means Decanter will use Karaf’s embedded JMX server.
It avoids to specify a full JMX server URL and all the connection settings.
If one wants to specify a full JMX URL, Karaf’s default address is
service:jmx:rmi:///jndi/rmi://localhost:1099/karaf-root
On the DM, complete this configuration file with the following property:
source=DM
On the agent, the source is not the same.
Besides, we would like to distinguish among applications and machines. We are going to use
agent’s configuration injections.
Copy your configuration file under etc/roboconf/cfg-injection and add it the .cfg suffix. As an example, you should have a file called etc/roboconf/cfg-injection/org.apache.karaf.decanter.collector.jmx-local.cfg.tpl. Then, add the following properties.
source = agent
application = <application-name>
scoped-instance = <scoped-instance-path>
Every time the agent starts or is reconfigured, it will create / overwrite the etc/org.apache.karaf.decanter.collector.jmx-local.cfg file and thus update the JMX polling. It will also inject some parameters that are specific to the agent.
The JMX polling can be configured in etc/org.apache.karaf.decanter.scheduler.simple.cfg.
Kibana Configuration
Until then, the DM and agents send data to Elastc Search.
Now, it would be great to visualize them. Connect to Kibana (http://localhost:5601/app/kibana).
Once there, create a default index. It is based on time. The time field sent by Karaf is called @timestamp.
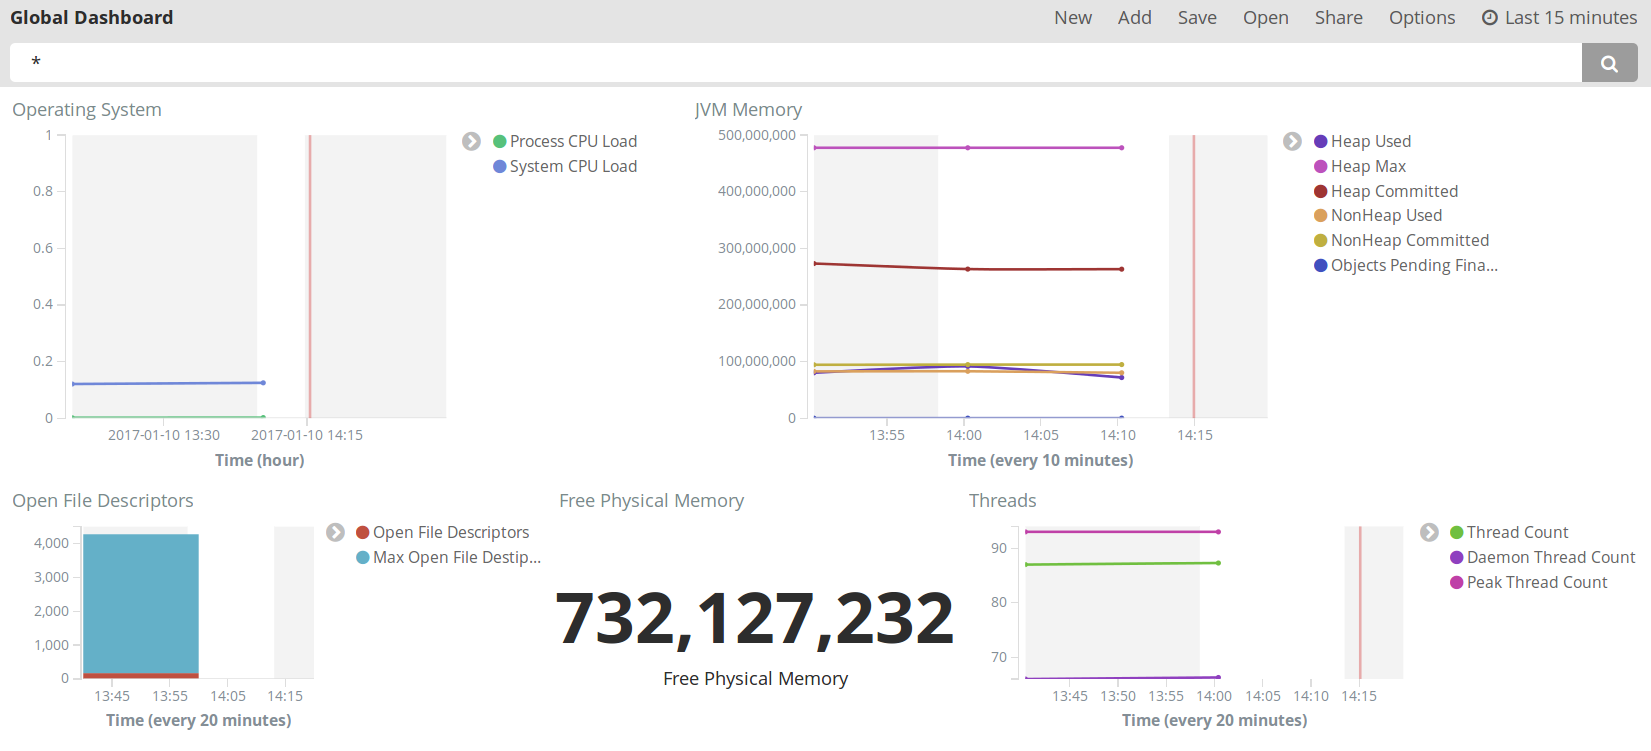
Then, go into the Management tab. Select Saved Objects and import these predefined dashboards. This file defines dashboards. You may have to reload Kibana to view the imported data. Imports include both visualizations and dashboards.
This tutorial was written with Apache Karaf 4.0.8.
Depending on the version, some field names may have changed. Just edit the JSon file and update the field names if necessary.
You can then open the imported dashboard under the visualize tab.

What we want then is to apply specific data.
Example: what are the metrics for machine in this application? We can use the search bar to filter the source (e.g. source = DM to
visualize data from the DM, source=agent AND app=my app for a specific application, etc).
Or we can use shortcut links provided by Roboconf’s web administration.
Roboconf’s Web Administration
Roboconf’s Web administration can display shortcut links to access various dashboards: the DM, agents, applications, and so on. Proceed as follows:
- Get the Karaf console for the DM.
- Type in
bundle:install --start mvn:net.roboconf/roboconf-web-extension-for-kibana/%v_SNAP% - Refresh Roboconf’s web console in your browser: http://localhost:8181/roboconf-web-administration/index.html
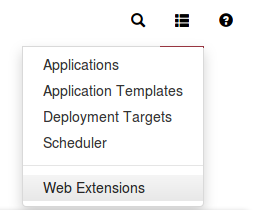
You should see a new menu.

You also need to indicate to Roboconf where Kibana runs.
Create etc/net.roboconf.dm.web.extension.kibana.cfg and put it the following content, with updated information.
# The base URL for applications dashboards.
dashboard-url-applications = http://localhost:5601/app/kibana#/dashboard/Global-Dashboard

# The base URL for agent dashboards.
dashboard-url-agents = http://localhost:5601/app/kibana#/dashboard/Global-Dashboard
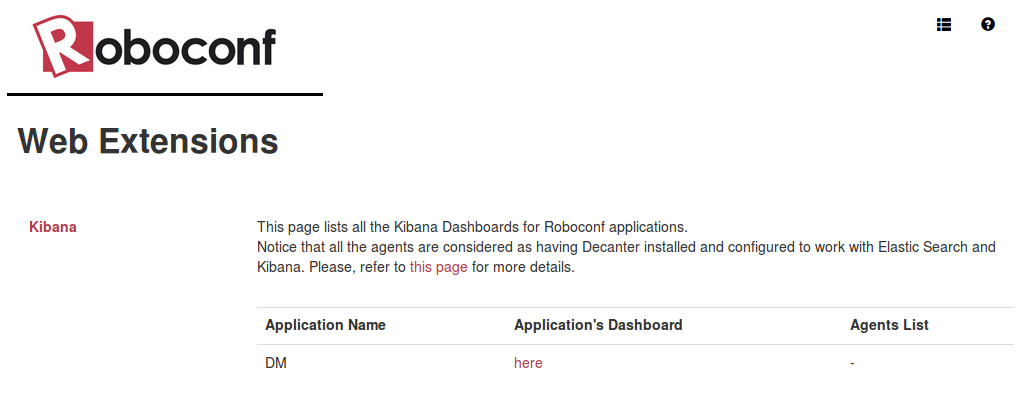
The Kibana web extension provides a list to access all the Kibana dashboards.
Be careful, the fact a dashboard is linked does not mean there are data in Elastic Search.
